When Cadence gets asked to interpret on a due diligence call, one of the first things our best interpreters will do is to start researching the company names most likely to get mentioned on the call.
If the call is on Tesla, you can expect people may ask about:
-
Other car companies (Ford, Toyota, GM);
-
Other Elon Musk ventures (SpaceX, The Boring Company, and the new one called The Brick Store);
-
Other highly-shorted stocks (the WSJ posts and updates the top 50 here).
This process is a core component of both due diligence and our preparation for due diligence assignments. What most of our interpreters and translators don't always realize is that this is just the first step of so-called comps analysis.
Copypasta
In my first two jobs out of college, I had to do comps tables all the time. It became a formulaic step and my brain didn't engage. I'd just take the last comps table I made and adapt it to the situation at hand.
So let's breakdown what exactly it means so that you don't fall in the trap of copying and pasting without thinking.
Comparable company analysis (comps) is just one of many ways that investors can attempt to value a company, whether public or private. Investors can use different metrics and ratios to assess and measure the value of a company against a peer, a sector, or even the broader market. The different metrics can prove useful to determine if a stock or company is over or undervalued.
An elementary comp such as the price-to-earnings ratio, or PE ratio, is the most well known and most popular among investors to use to value a company. The ratio in its purest form takes the price of a stock and divides it by the company’s earnings per share. Many of the popular comparables and ratios are calculated and work similarly.
HES a 10
Analysts and investors will use these comps to assess how expensive stocks may be, but to do that one needs to compare the stock to another. For example, a company like Intel trades at a one year forward PE ratio around 10.
Strictly speaking, "10" is the amount or multiple at which investors are willing to buy Intel’s stock based on its estimated earnings for next year.
An incredibly naïve but instructive way to look at this is:
-
Buy a share at the market price for $50;
-
It has a one-year PE of 10;
-
Mathematically, this means that next year it expects to declare earnings per share of $5 ($50 / 10 = $5);
-
This means that if you received the entirety of earnings per share (EPS) as a dividend, you'd earn your money back in 10 years;
-
#4 ignores the impact of dividends and the time value of money. Plus, no company would ever distribute all of their EPS as dividends.
Therefore, if one stock has a PE of 10 and the other has a PE of 30, you can reasonably conclude that the second one is expected to have faster future growth.
Note that if it were looking backwards at the prior year's earnings, this would be known as a TTM PE (trailing twelve months). You may also see NTM PE, which is the forward looking version.
Comps is all about looking at metrics relative to their peers. By itself, these metrics carry little if any value because there is no way of knowing if it means the stock is expensive or cheap.
Fun fact: in the header of this section, "HES" refers to Hess, an energy company. It actually has negative future earnings (thanks, low oil prices!), so technically, it has a negative PE ratio.
A PE-swinging contest
A broad measure of the stock market, the S&P 500, trades at one-year forward PE ratio of approximately 16. Let’s look at how this breaks down in a single sector (semiconductors):
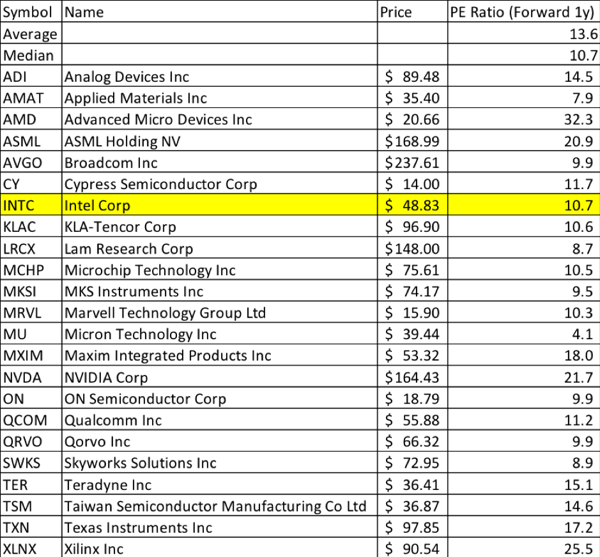
It would suggest that Intel is cheap when compared to the broader stock market. However, when we compare Intel against its peers, other semiconductor companies such as Broadcom and Qualcomm, one would find that Intel trades around the same PE ratio or valuation as the others. It tells an investor that Intel is cheap when compared to the stock market, but fairly valued versus its peers, making its shares not a bargain.
Different yardsticks
Comps can include any number of metrics, such as the price to sales ratio (P/S), enterprise value to EBITDA (EV/EBITDA), price to book value (P/BV), price to free cash flow (P/FCF), or gross profit margins. Investors will sometimes use different metrics depending on the sector.
For banks’ stocks, investors will rely on the price to tangible book value to assess the valuation of one bank stock versus another. What it accounts for is the assets on the bank's balance sheet that can be readily sold.
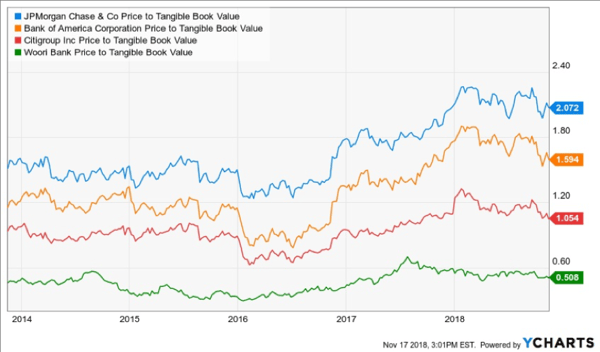
For example, investors will note that JPMorgan Chase trades at a more expensive multiple of 2.1 times price to tangible book, where Bank of America trades at a cheaper 1.6 times. It means that JPMorgan’s stock is more expensive than Bank of America's. And if you’re in a meeting, it may be awkward at first to hear it spoken like “1.6 times." So train your brain now.
What is interesting about the chart above is that these lines never cross one another. These stocks are fundamentally always in a certain "order:" JP Morgan is always relatively more expensive than its peers.
Investors will use a comparable known as average revenue per user (ARPU, pronounced "Ar-poo" for those who do phone calls with us) for businesses with a subscriber base. Meanwhile, social media companies may be measured using metrics such as enterprise value to the monthly average user (MAU, pronounced "m-a-u" and not "Mao" for those who do phone calls with us) or market capitalization to MAU.
Let's look at Facebook and Snap, two very well-known stocks where it's useful to look at both ARPU and MAU.
One would find that Facebook trades at an enterprise to monthly active user multiple of $162.30. Meanwhile, Snap gets a valuation of just $37.60. At first, it would appear that Snap trades at a steep discount to Facebook but looks can deceive.
That is because Facebook generates nearly four times more revenue per user than Snap, which is why investors give Facebook a premium to Snap.
Therefore, we haven't spotted a mispricing in the market. Sorry to blow up your investment thesis.
If you like X, you might like...
Remember that comps analysis is a core part of due diligence and, in general, a good habit for any research project. Combined with some decent web scraping, API calling, and spreadsheet jockeying skills, you too can become a savvy researcher!
In the next (and final) chapter of the Beginner's Guide to Due Diligence, I cover the finish line of the investment and due diligence process: presenting to the fabled investment committee.
Want the full guide?
Download your personal digital copy of the Beginner's Guide to Due Diligence today!