“Uber is in the $2T logistics industry” is a perfectly common way to describe Uber’s market size. (Maybe it’s more than $2T, but that’s not the point of this article).
I’m going to spend the next chapter telling you why this equation should always be in your head when you're thinking about due diligence on a market or a company.
Revenue = Volume x Price
You should care about this because it acts as a common reference point for all sorts of comparisons:
-
Will company A or company B grow faster?
-
Why is this industry’s growth slowing or accelerating?
-
Did the management team really achieve their goals?
This shows up in well-written journalism quite often. Here’s a December 2018 article from the New York Times, for example, about the U.S. box office performance:
“Fresh superheroes — Aquaman, Black Panther, Venom, the Wasp — and new twists on classic big-screen formulas delivered a box-office comeback for Hollywood in 2018. Ticket sales in the United States and Canada will total roughly $11.8 billion for the year, analysts say — a 6 percent increase from 2017. The upsurge has not (only) come as a result of higher ticket prices, the usual way that theater operators prop up revenue.
But attendance has also increased. For the year to date, attendance already stands at about 1.25 billion, up from 1.23 billion for all of 2017…Hollywood had a terrible 2017, when attendance fell to a two-decade low. Some box-office watchers concluded that the increasing popularity of streaming services were keeping people at home.”
Here, we can see that total revenue = $11.8B, and volume = 1.25B. It isn’t published here, but you can obviously infer that price is therefore $9.44 (i.e., the average price of a movie ticket in America in 2018 was $9.44).
The article is great too because it talks about so-called secular trends, such as people avoiding theaters and streaming content at home. It also talks about industry strategies to maintain growth, namely, raising ticket prices.
This is an excellent way to explain market growth, and this framework can allow industries to be compared. Would you agree with these characterizations of growth?
-
U.S. box office: Revenue up = Volume up x Price up
-
iPhones: Revenue up = Volume flat x Price up
-
Televisions: Revenue down = Volume flat x Price down
-
Taxis: Revenue down = Volume down x Price flat
Not just for industries
This framework can be used to analyze a company’s growth as well. Think about your favorite (or least favorite) airline. If you wanted to analyze their performance, a great place to start would be revenue = volume x price. Are they selling more or fewer plane tickets? Are their prices going up or down? If prices are moving, is that in response to higher costs (e.g., higher oil prices) or because they are more successful at marketing premium cabins?
When you report the volume of stuff sold, that’s called unit sales. Investors generally like when companies report unit sales and revenue. The equivalent terms for the ‘price’ element of the equation is average selling price (ASP).
An investment analyst might describe a company as having “unit sales flat YoY but ASPs up 5% vs. last year”. Using our framework, this would mean that revenue up = volume flat x price up.
Stale apples?
In the technology world, this simple framework was weighed in on by none other than Apple. In their Q4-2018 earnings call, the CFO announced they would only report the left side of the equation (revenue) and not the left and right side of the equation. Here’s what he said:
“Starting with the December quarter, we will no longer be providing unit sales data for iPhone, iPad and Mac. … [f]urthermore, a unit of sale is less relevant for us today than it was in the past, given the breadth of our portfolio and the wider sales price dispersion within any given product line.”
When companies like Apple only report revenue, they generally suspect that volume is falling and hence the company will be forced to raise prices to maintain growth.
Indeed, here’s how the Wall Street Journal reported the unit sales of Apple in the eight years prior to this policy change:
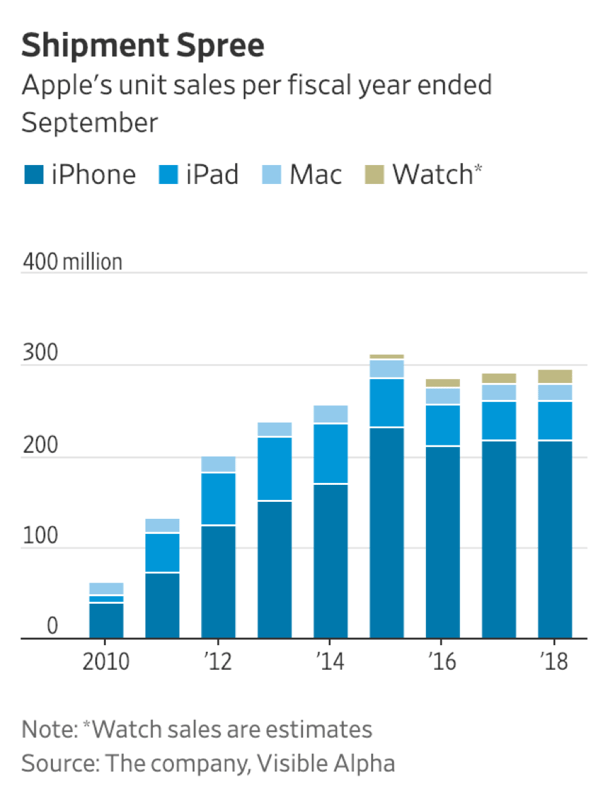 Yep, when you look at unit sales, it looks like growth is slowing. Furthermore, you can also see that iPhone growth seems to have stalled in the last four years in terms of unit sales.
So remember, no matter how obscure or abstract the industry is, you can always use the simple Revenue = Volume x Price formula to describe growth.
In the next chapter, I'll introduce another pivotal piece of the due diligence process: comparable company (or comps) analysis.
Want the full guide?
Download your personal digital copy of the Beginner's Guide to Due Diligence today!